如何在jupyter中使用typescript基于plotly.js画图
plotly.js是JavaScript图表库,可以创建交互式和响应式的数据可视化图表。
plotly.js支持各种图表类型,折线图、散点图、柱状图、饼图等,可与TypeScript无缝集成。
这里尝试在jupyter环境中使用typescript基于plotly.js画图。所用示例参考和修改自网络资料。
最后验证结果显示,好像在jupyter中不能使用plotly.js画图,所以这步没有走通,暂作记录。
后续尝试发现Observable Plot 可以,并给出测试示例。
1 工具安装
1.1 安装plotly.js
1)安装plotly.js包
首先,使用npm安装plotly.js,将plotly.js库安装到typescript项目中。
npm install plotly.js
或者
npm i --save-dev @types/plotly.js
2)验证plotly.js安装
可以通过使用import关键字来引入plotly.js,检查程序是否报错,代码示例如下。
如果不报错,比如在vscode中不飘红,说明plotly.js安装成功。
import * as Plotly from 'plotly.js';代码将整个plotly.js库导入到名为Plotly命名空间,使用Plotly访问所有plotly.js的功能和方法。
1.2 安装jupyter
jupyter是画图时经常会使用的工具,这里基于jupyter界面,使用plotly.js画图。
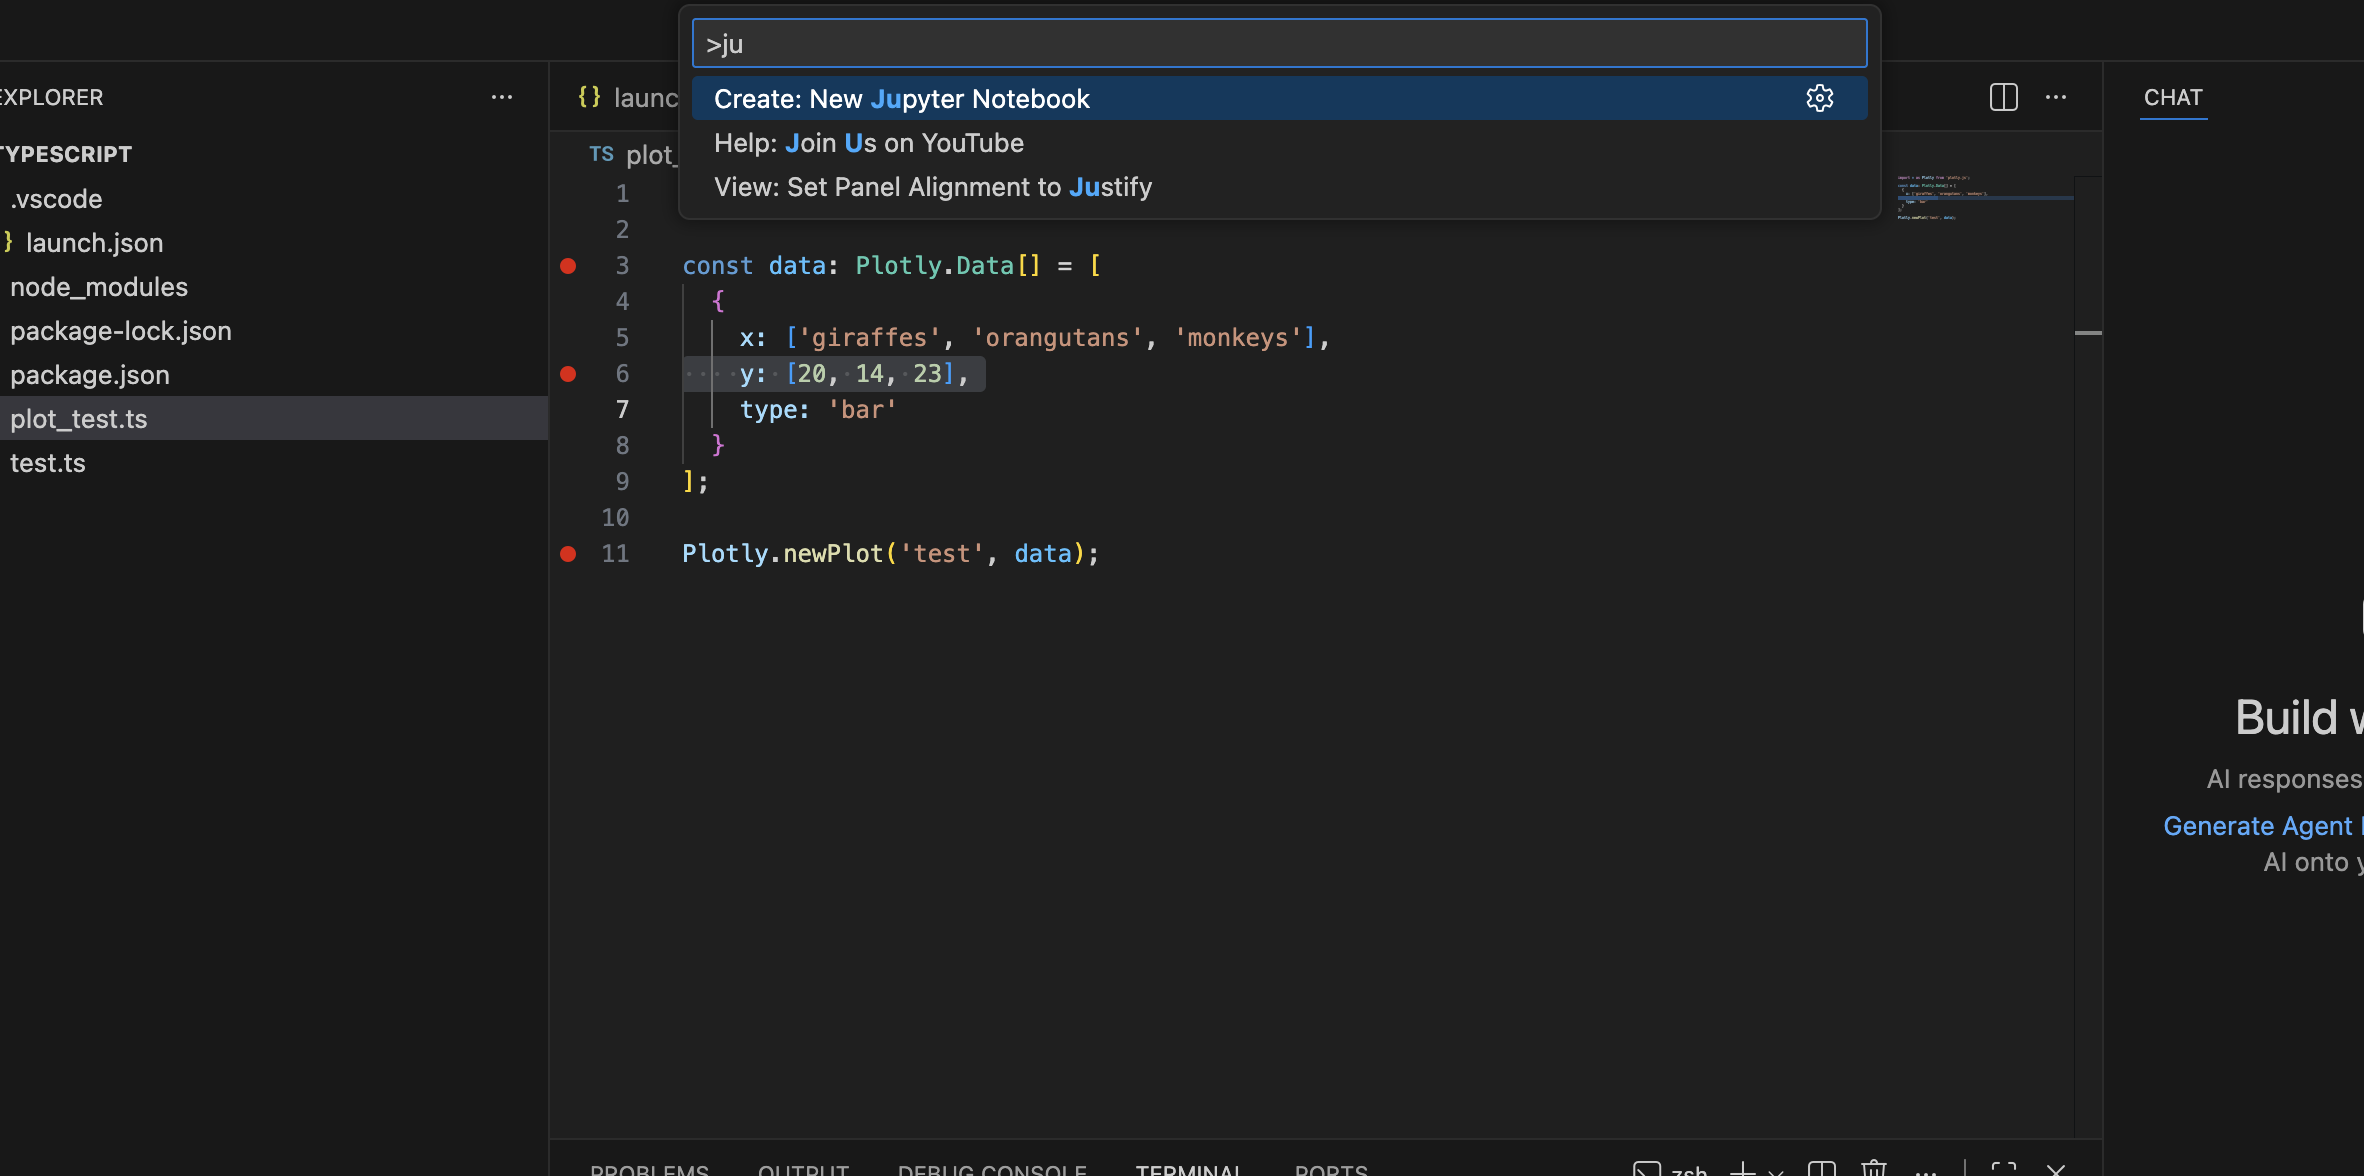
1)搜索jupyter note扩展
在vscode中,打开扩展搜索栏,具体为
快捷键为ctrl+shit+P,在mac中为command + shift+P,
示例如下
2)安装打开jupyter
点击New Jupyter Notebook,然后打开,示例如下
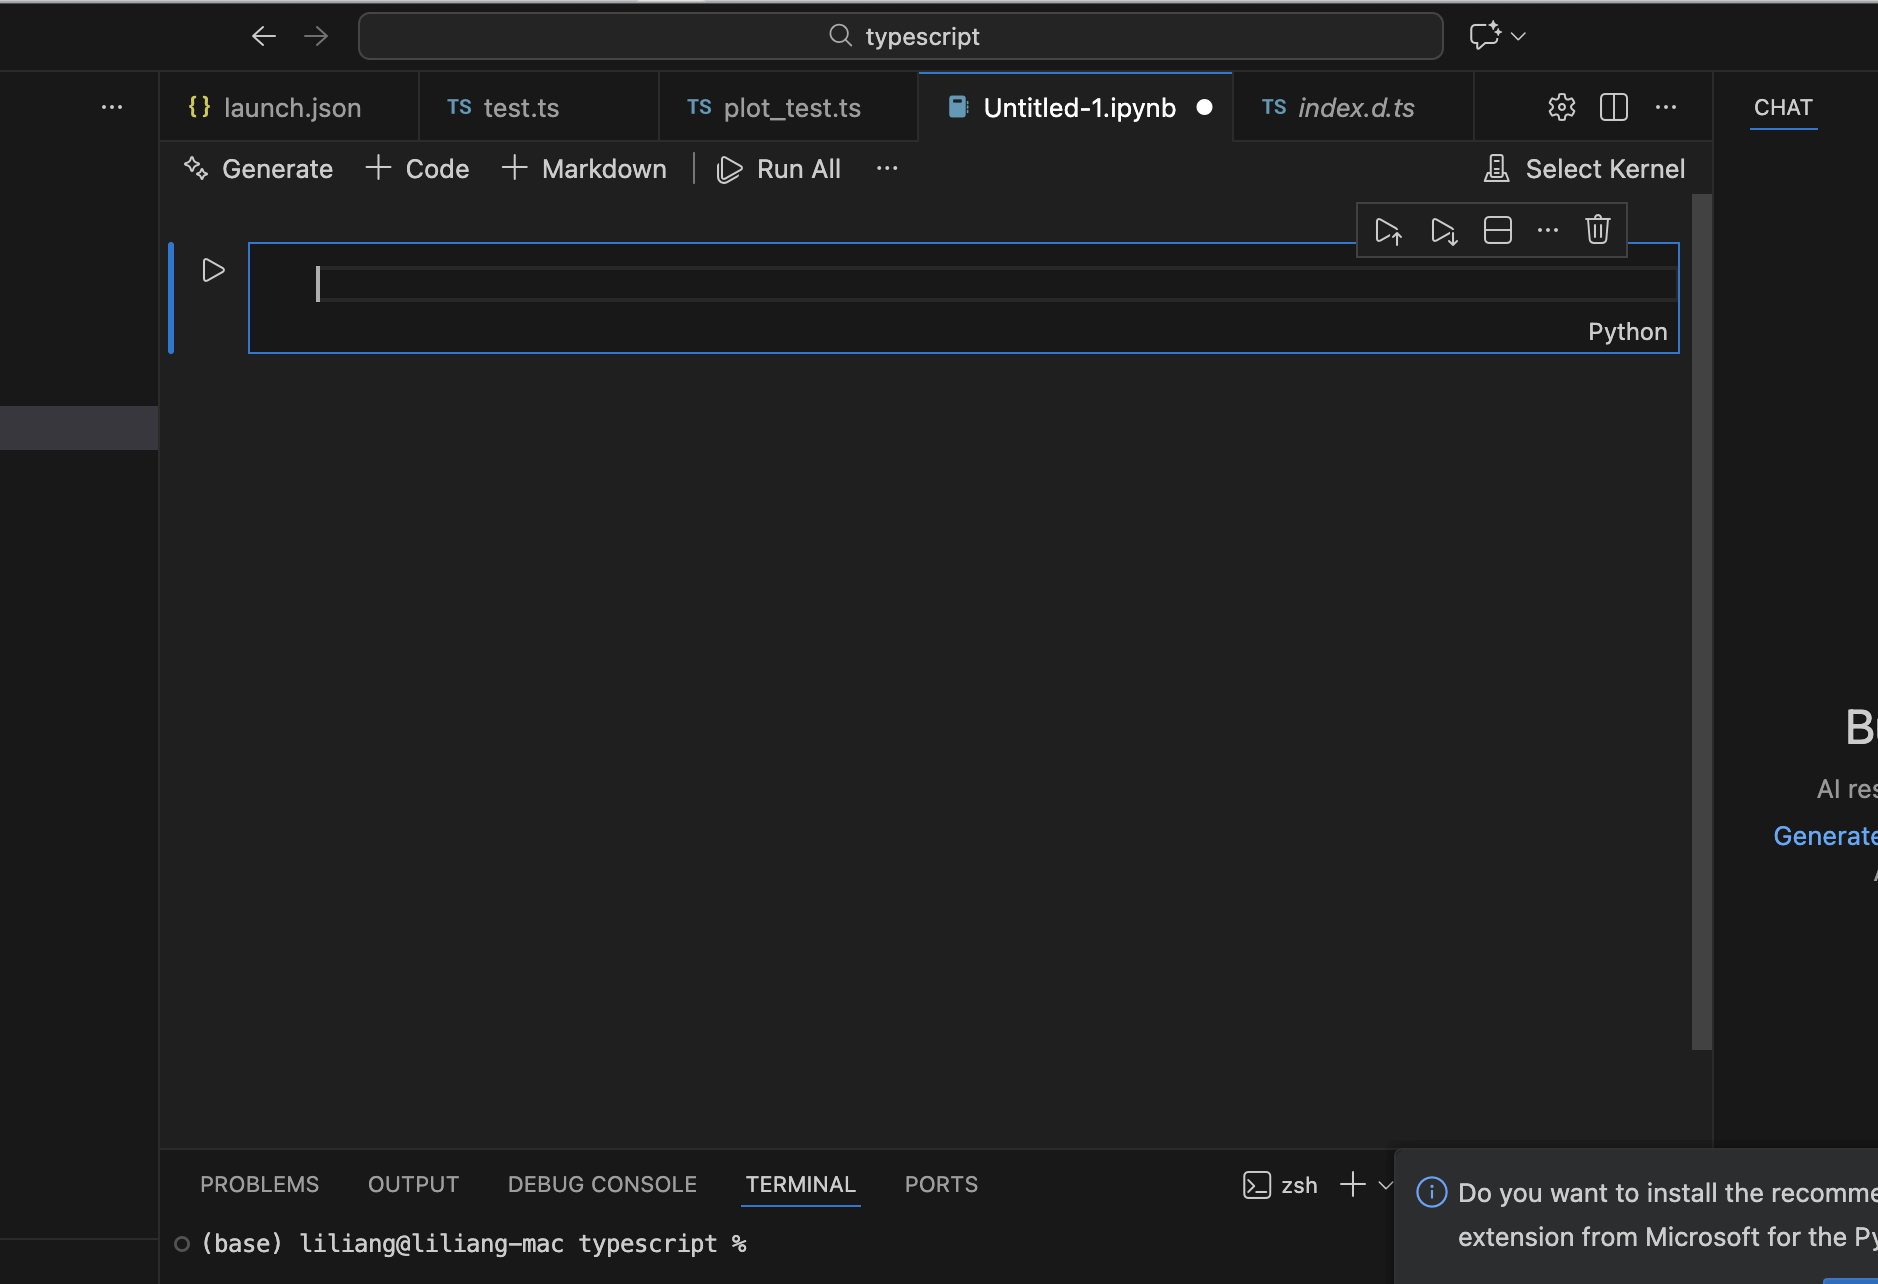
将jupyternode的语言从python切换为typescript,因为这里要使用typescript画图。
1.3 安装deno
1)deno
deno是在jupyter中运行ts的依赖工具,所以需要安装。
curl -fsSL https://deno.land/install.sh | sh
2)jupyter kenel for deno
然后按照官方文档安装 Jupyter Kernel for Deno。
deno jupyter --install
https://docs.deno.com/runtime/reference/cli/jupyter/
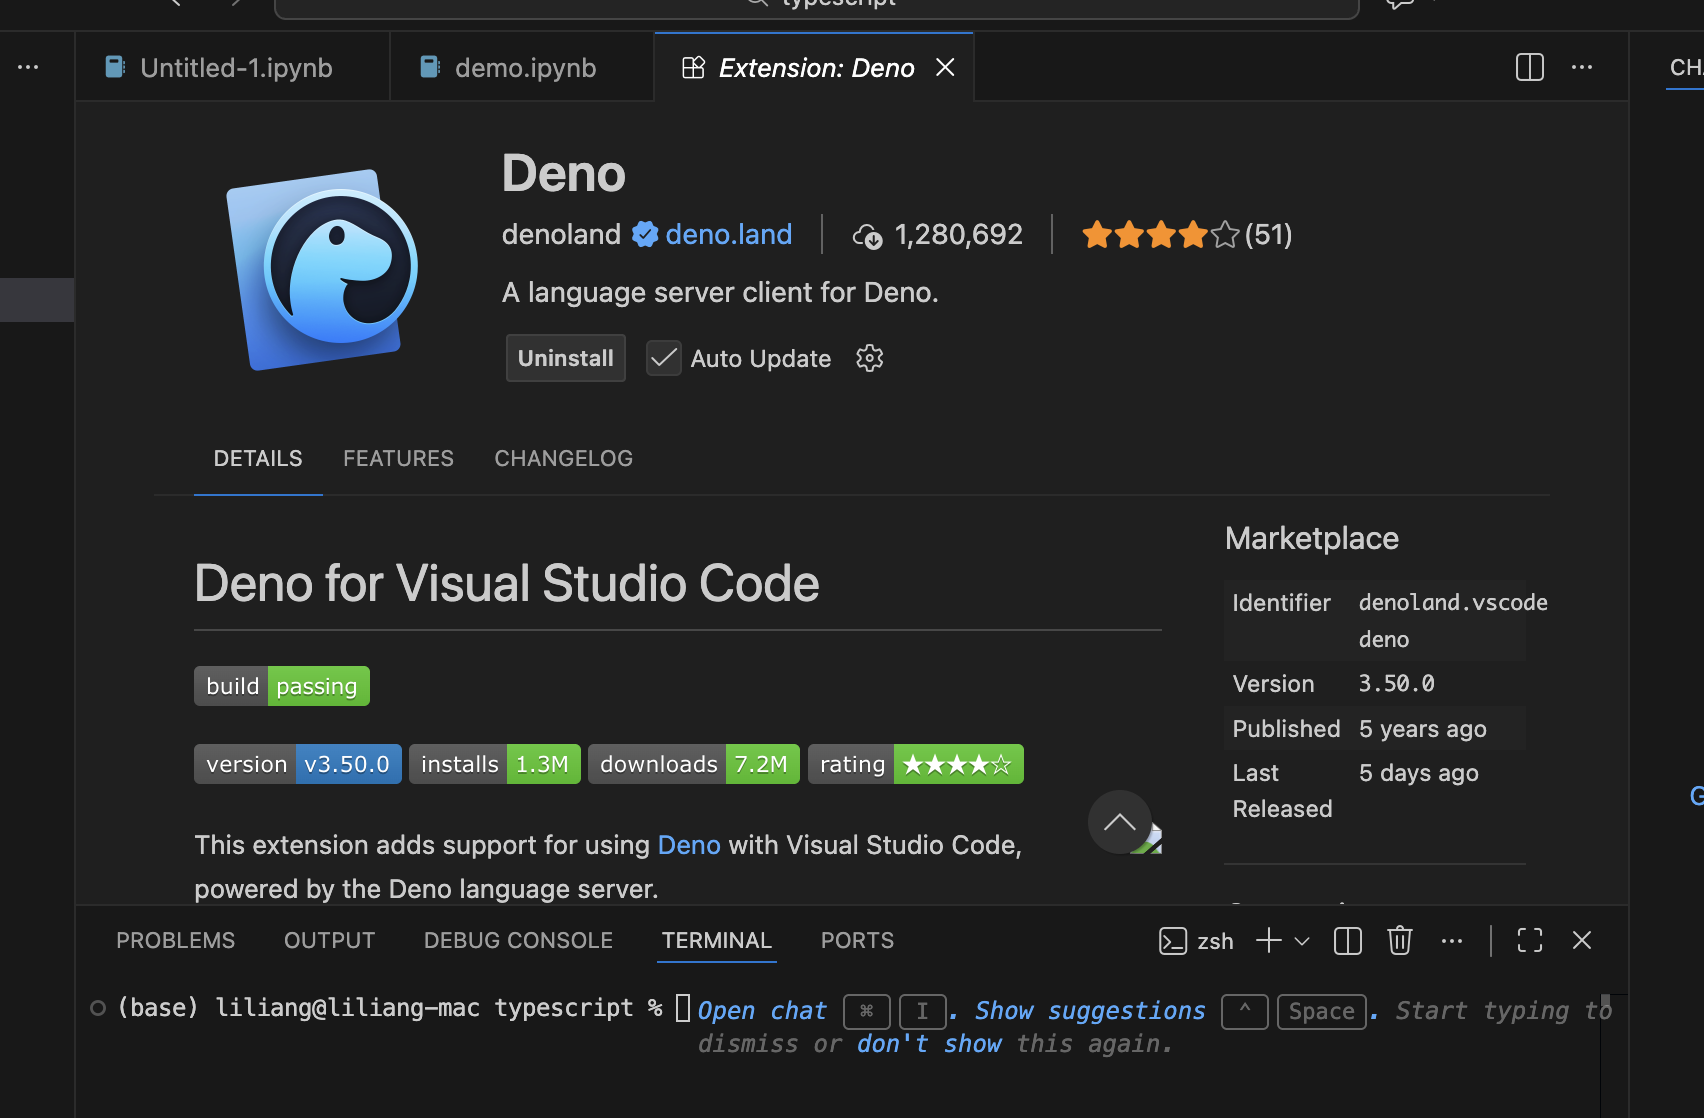
3)deno for vsvode
然后点击如下链接,安装deno插件Deno for Visual Studio Code
https://marketplace.visualstudio.com/items?itemName=denoland.vscode-deno
4)创建空deno.jsonc
确保 .ipynb 文件所在的目录/上级目录有一个 deno.json 或 deno.jsonc配置文件,这个文件可以是空的(只有 {}),但必须存在,否则 VS Code 插件无法识别 Deno 环境,导致代码补全等功能失效。
5)切换kernel
在vs项目闯将demo.ipynb,打开并将Jupyter Kernel切换到Deno即可。
输入ts代码即可运行,示例如下
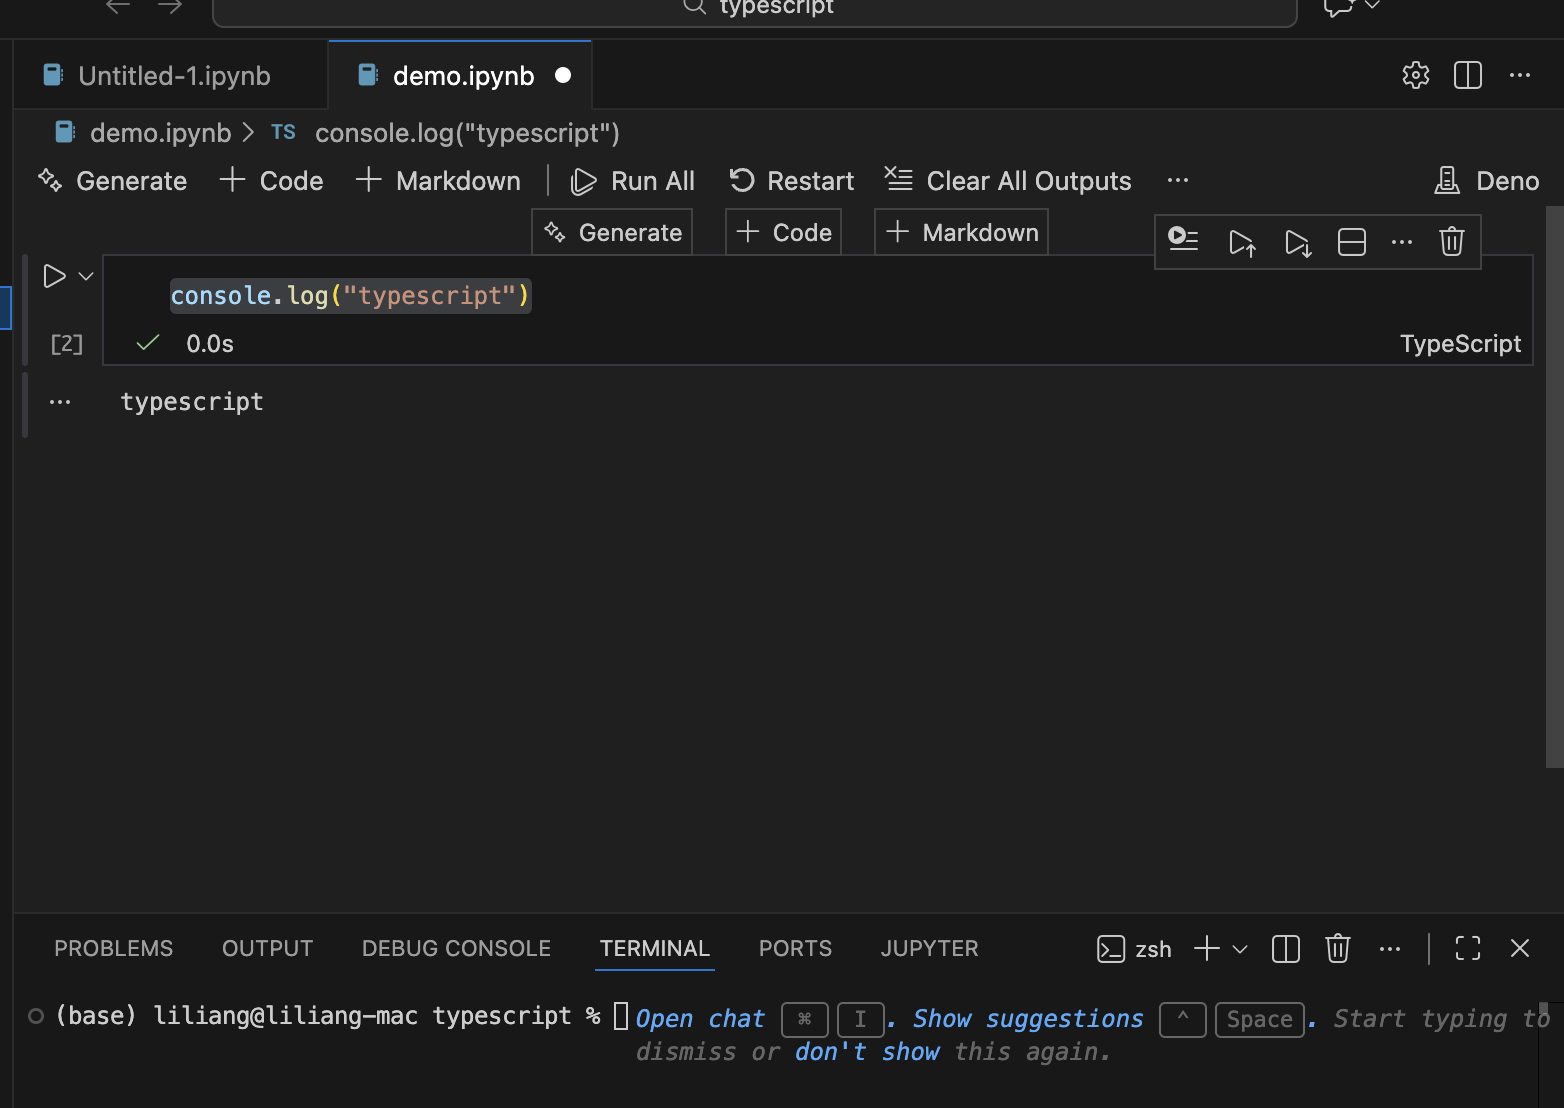
测试jupyter deno环境配置完成。
2 画图测试
2.1 ts编码测试
在上述demo.ipynb中,首先运行普通ts代码,示例如下
// test.ts

const towSum1 = (nums: number[], target: number): number[] => {
  const map = new Map();
  for (let i = 0; i < nums.length; i++) {
    const complement = target - nums[i];
    if (map.has(complement)) {
      return [map.get(complement), i];
    }
    map.set(nums[i], i);
  }
  return [];
};

console.log(towSum1([2, 7, 11, 15], 9));
输出如下,说明代码运行成功。
[ 0, 1 ]
2.2 plotly.js画图测试
这里进一步基于plotly.js画图运行画图测试。
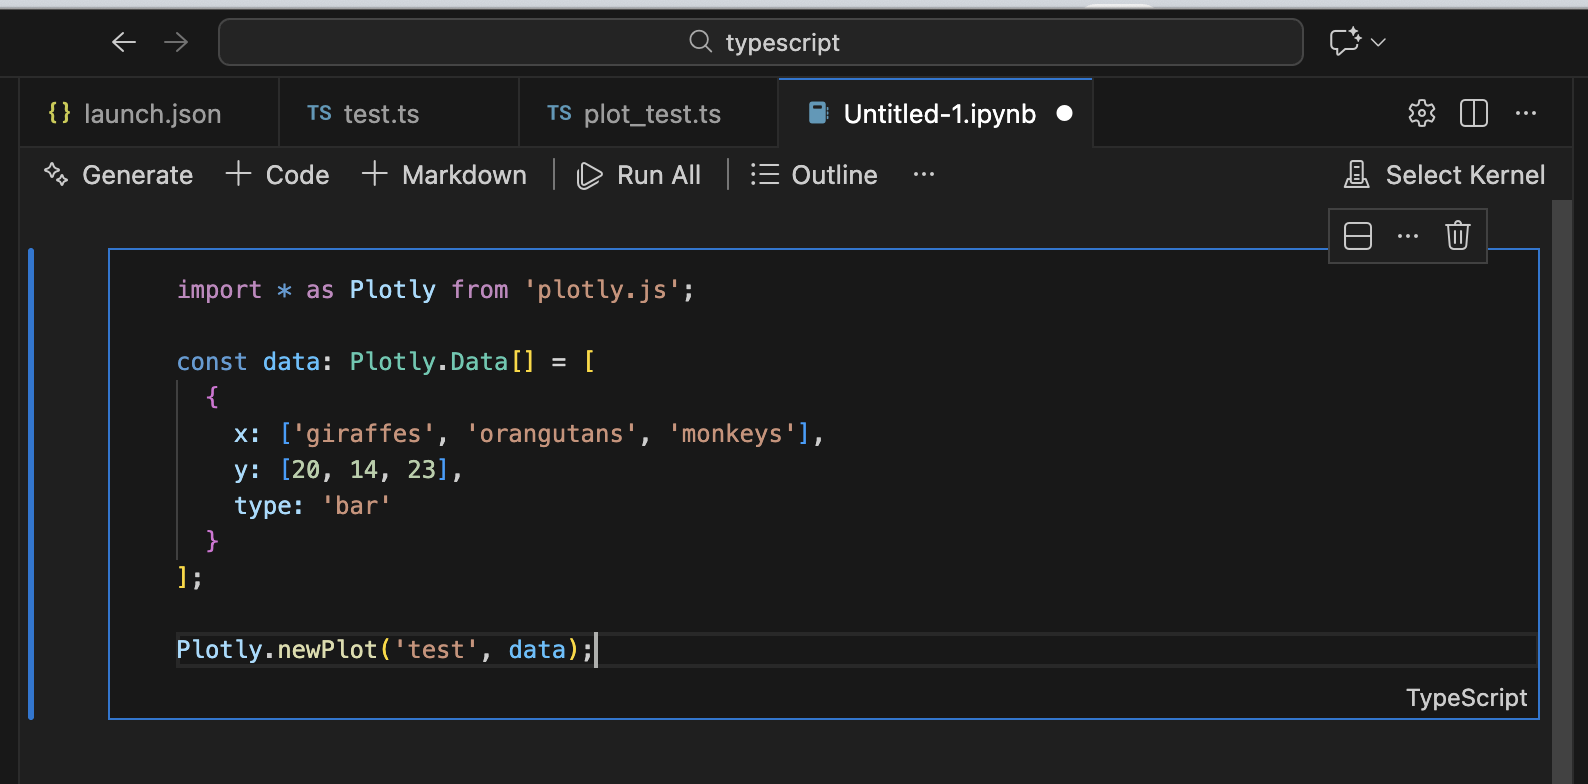
import * as Plotly1 from 'plotly.js';

const data: Plotly1.Data[] = [
  {
    x: ['giraffes', 'orangutans', 'monkeys'],
    y: [20, 14, 23],
    type: 'bar'
  }
];

Plotly1.newPlot('test', data);
异常示例如下
Stack trace:
ReferenceError: window is not defined
at isPlainObject
相关资料显示,这个问题好像没解决。
https://github.com/plotly/plotly.js/issues/6506#event-13394862674
所以在jupyter上机遇ts使用poltly.js画图没有走通。
这里暂作记录,等后续解决方案。
2.3 Observable Plot 画图测试
plotly.js在jupyter不能有效画图,但是别的方式比如Observable Plot 可以。
以下是我们的尝试。
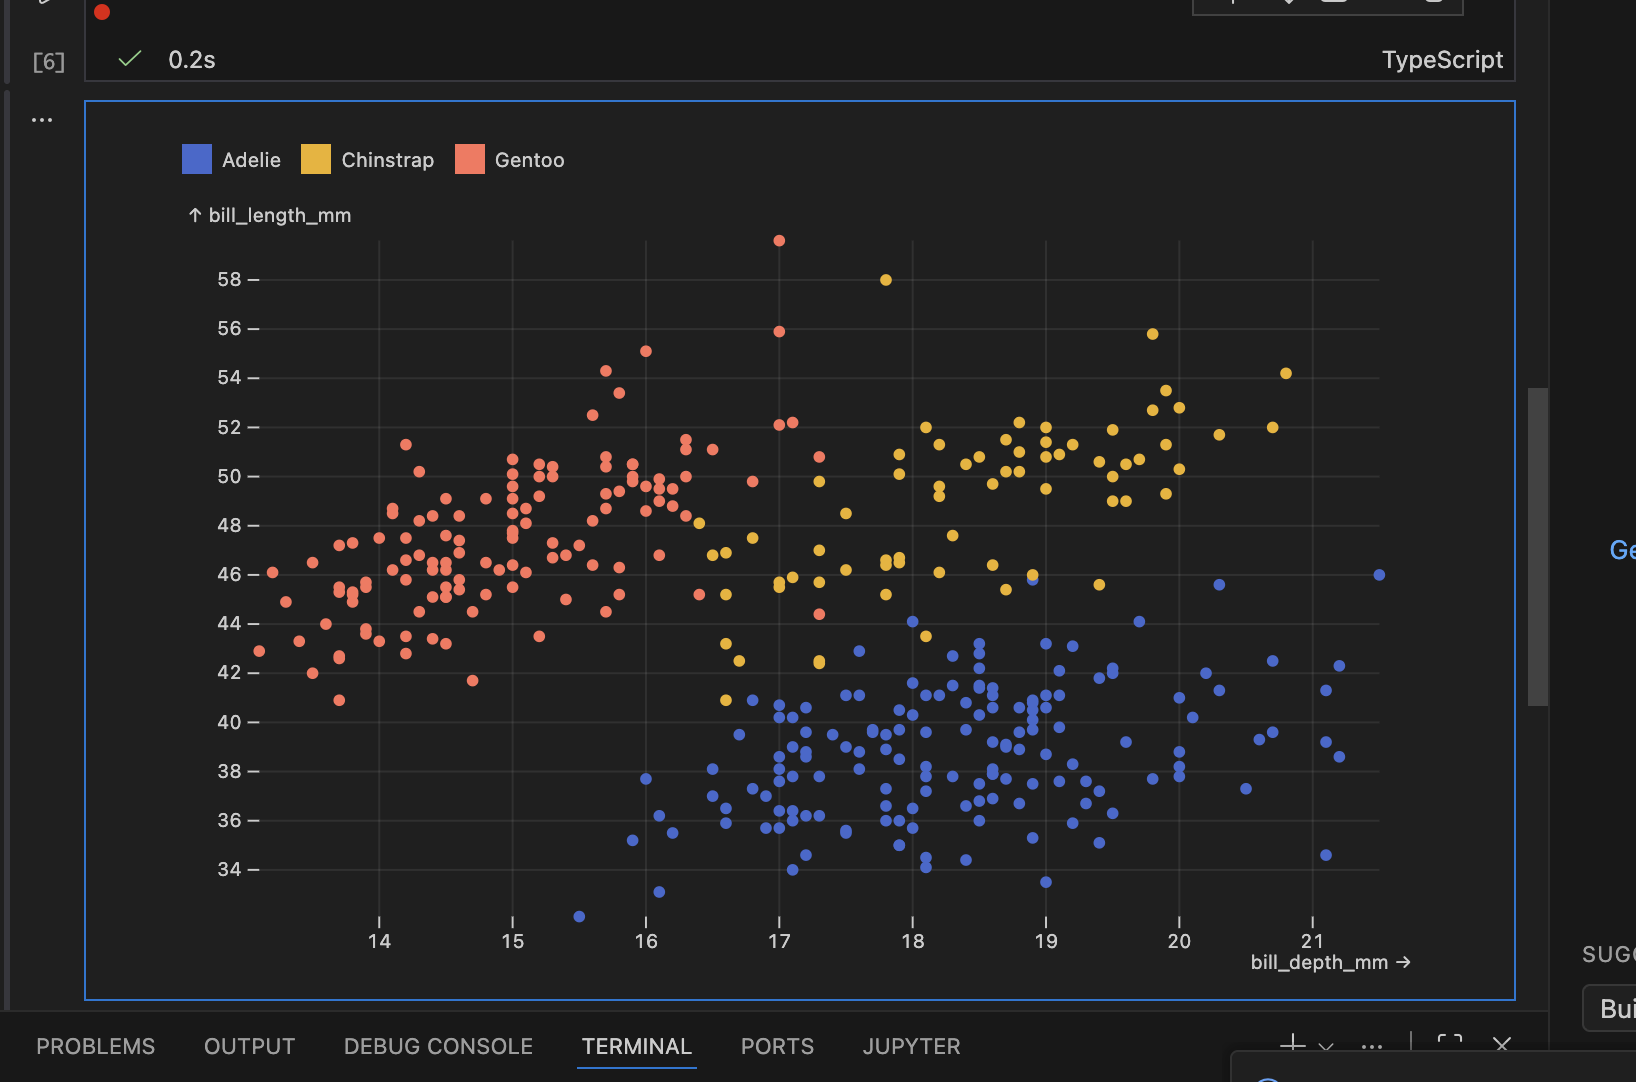
从一个数据源的csv文件中获取数据,提取列bill_depth_mm、bill_length_mm、spicies。
bill_depth_mm和bill_length_mm分别作为x和y,spices作为图例数据,以散点图形式呈现。
示例代码如下所示。
import * as Plot from "npm:@observablehq/plot";
import * as d3 from "npm:d3";
import { JSDOM } from "npm:jsdom";
import * as pl from "npm:nodejs-polars";

const raw = await fetch(
  "https://gitee.com/muyihao/seaborn-data/raw/master/penguins.csv",
).then((res) => res.text());
const penguins = pl.readCSV(raw).toRecords();

Plot.plot({
  color: { legend: true },
  grid: true,
  marks: [
    Plot.dot(penguins, {
      x: "bill_depth_mm",
      y: "bill_length_mm",
      fill: "species",
    }),
  ],
  document: new JSDOM().window.document,
});
在jupyter中可视化输出如下所示,将三种不同企鹅的size数据以散点图形式呈现。
测试数据来源
https://gitee.com/muyihao/seaborn-data/raw/master/penguins.csv
Observable Plot 相关包安装如下所示
npm i npm:@observablehq/plot
npm i npm:d3
npm i npm:jsdom
npm i nodejs-polars
reference
---
TypeScript 如何在TypeScript中引入plotly.js
tslab-plotly
https://github.com/dbuezas/tslab-plotly
VS Code 中使用 Jupyter Notebook
https://www.runoob.com/jupyter-notebook/jupyter-notebook-vscode.html
JS/TS+Deno+Jupyter 科研绘图指北
https://zhuanlan.zhihu.com/p/1966500766580705053
jupyter kernel for deno
https://docs.deno.com/runtime/reference/cli/jupyter/
deno
When i use Web Worker, i get 'window is not defined'. #6506
https://github.com/plotly/plotly.js/issues/6506#event-13394862674
偷偷告诉你,可以用 jupyter 写 ts 和 js 代码

助力广东及东莞地区开发者,代码托管、在线学习与竞赛、技术交流与分享、资源共享、职业发展,成为松山湖开发者首选的工作与学习平台
更多推荐


 24
24 0
0- 0


 已为社区贡献1条内容

所有评论(0)